
0
Design Exposition Discussion Documents for Rich Design Discourse in Applied Visualization
0
Criteria for Rigor in Visualization Design Study
0
A Framework for Creative Visualization-Opportunities Workshops
0
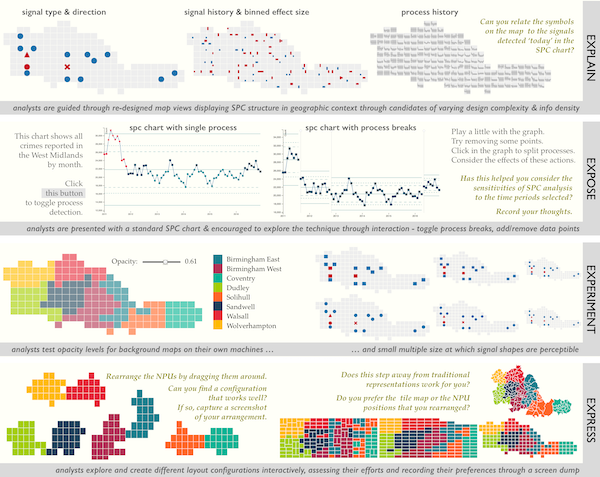
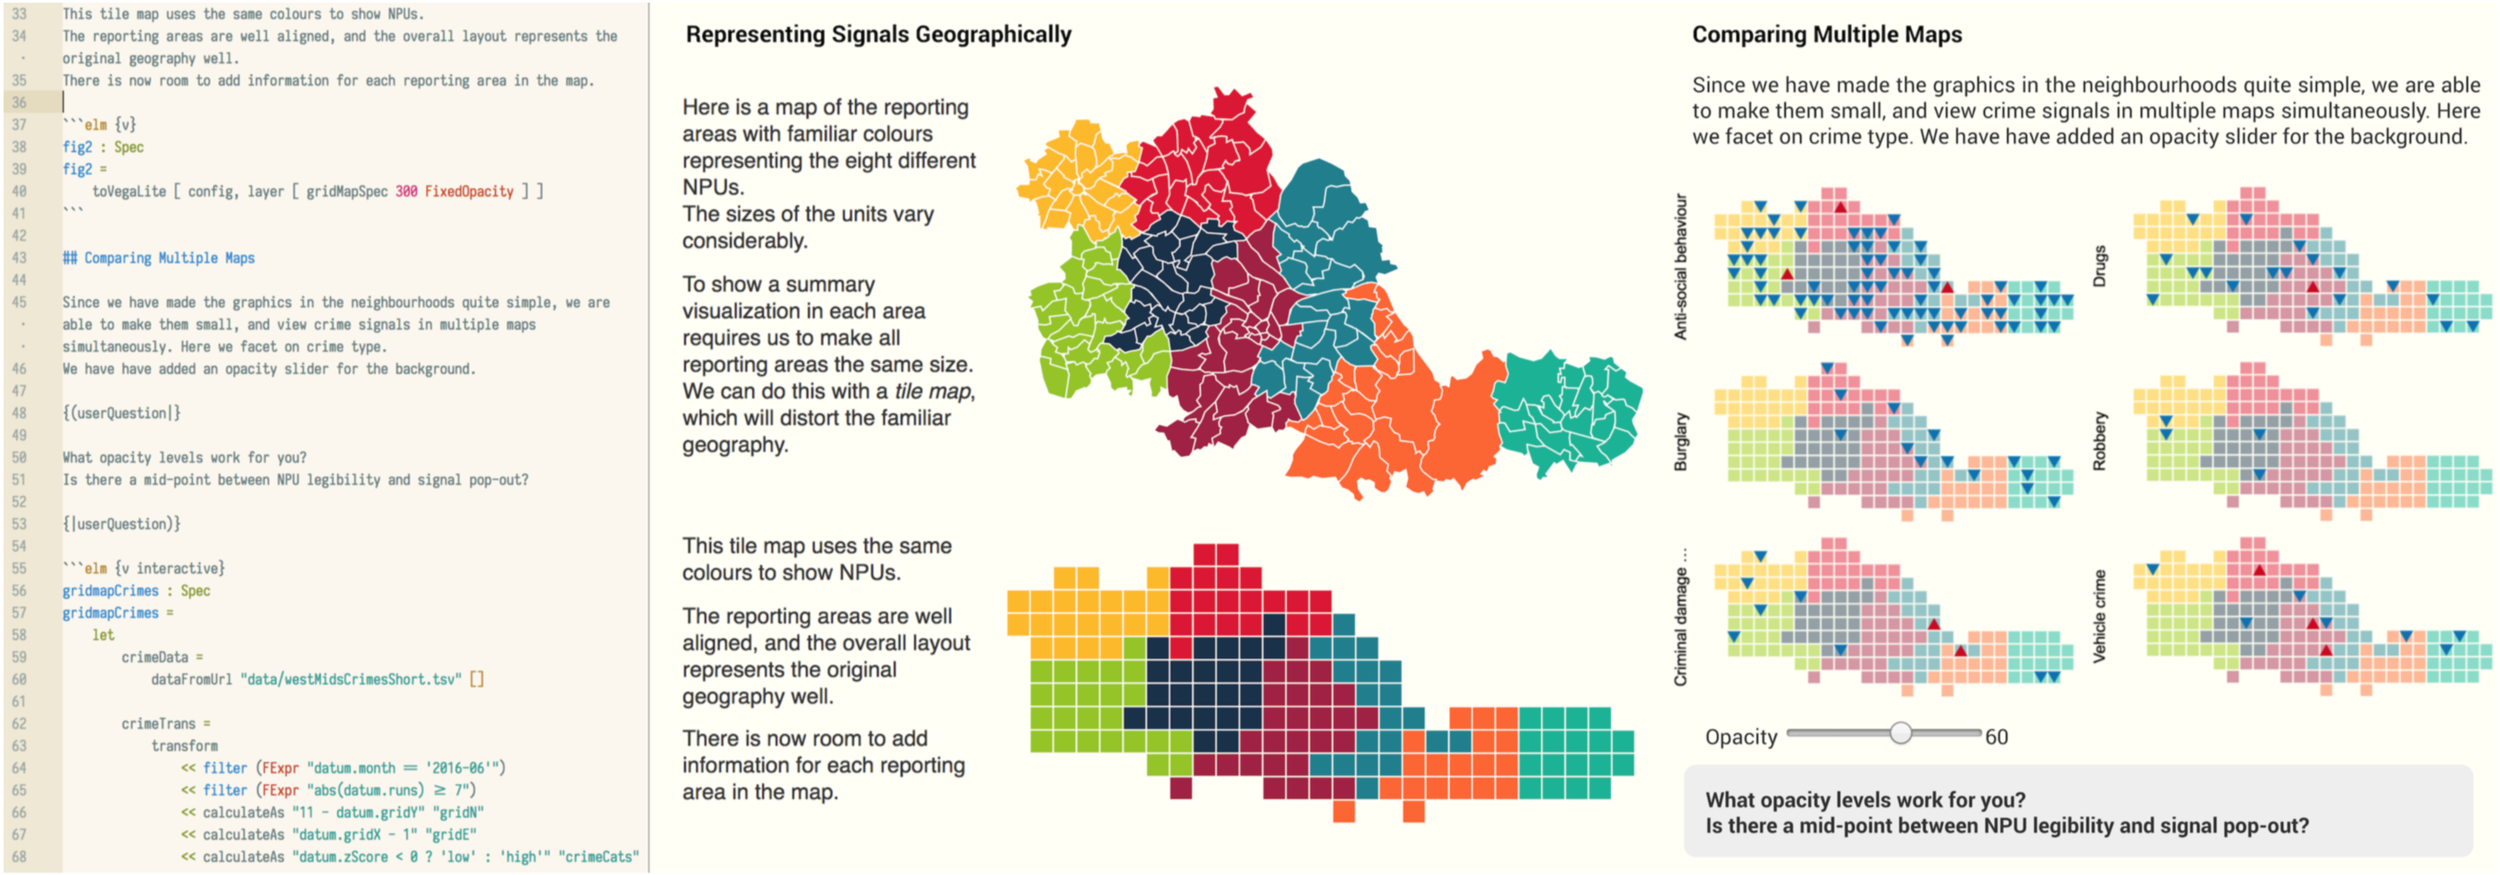
Design Exposition with Literate Visualization

0
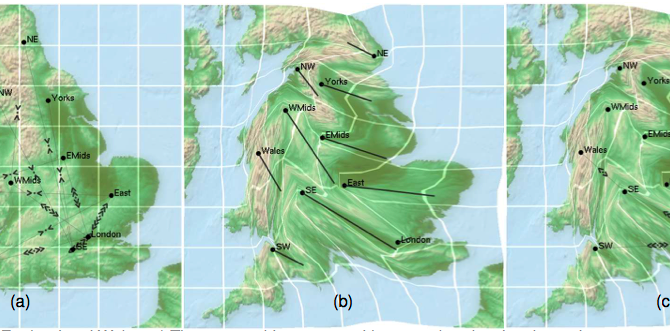
Locally-varying explanations behind the UK’s vote to the Leave the EU
0
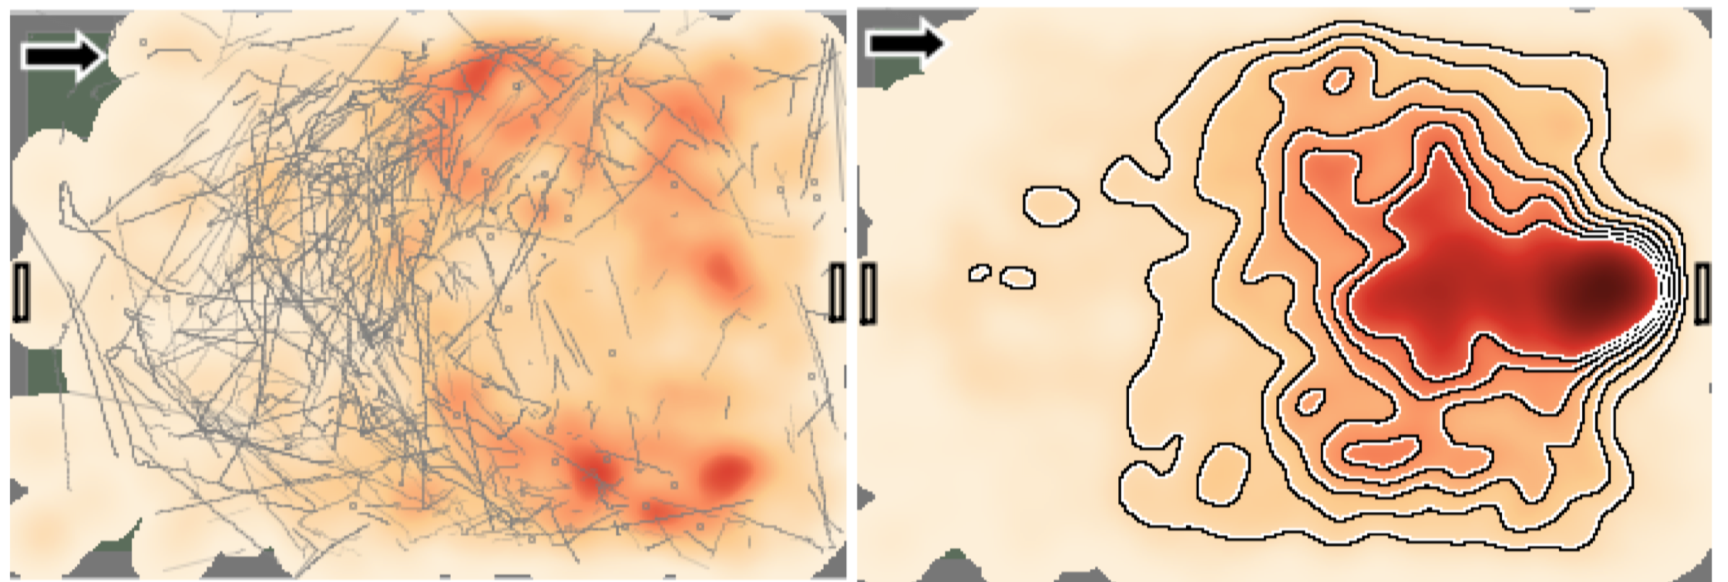
Visual Analysis of Pressure in Football

0
Understanding User Behaviour through Action Sequences: from the Usual to the Unusual

0
Hunting High and Low: Visualising Shifting Correlations in Financial Markets

0
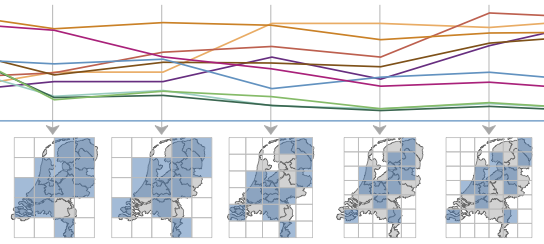
Map LineUps
0
Small Multiples with Gaps
0
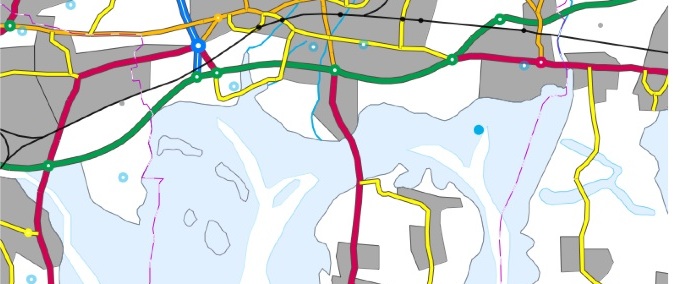
Topology-Preserving Map Deformation
0
Designing Progressive and Interactive Analytics

0
Faceted Views of Varying Emphasis
0
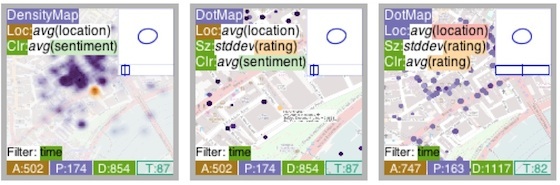
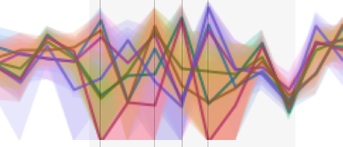
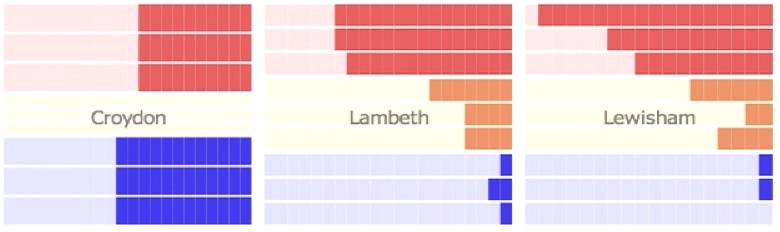
Visualizing Multiple Variables Across Scale and Geography
0
Glyphs for exploring crowd-sourced subjective survey classification
0
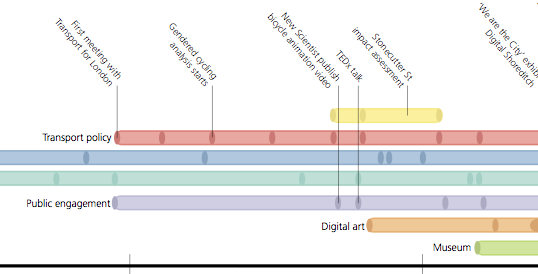
Moving beyond sequential design: Reflections on a rich multi-channel approach to data visualization
0
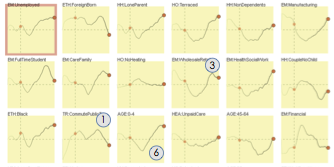
Attribute Signatures: Dynamic Visual Summaries for Analyzing Multivariate Geographical Data

0
Creative user-centered visualization design for energy analysts and modelers
0
An extensible framework for provenance in human terrain visual analytics

0
Sketchy rendering for information visualization
0
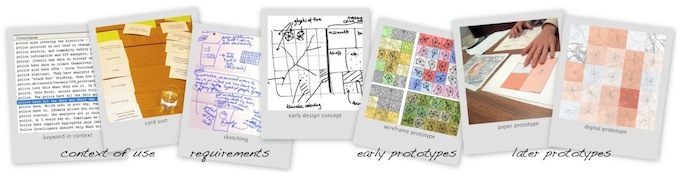
Human-centered approaches in geovisualization design
0
Exploring uncertainty in geodemographics with interactive graphics
0
BallotMaps: Detecting name bias in alphabetically ordered ballot papers

0
Visualizing the dynamics of London's bicycle hire scheme
0
Rethinking map legends with visualization

0
Visualisation of origins, destinations and flows with OD maps
0
Configuring hierarchical layouts to address research questions
0
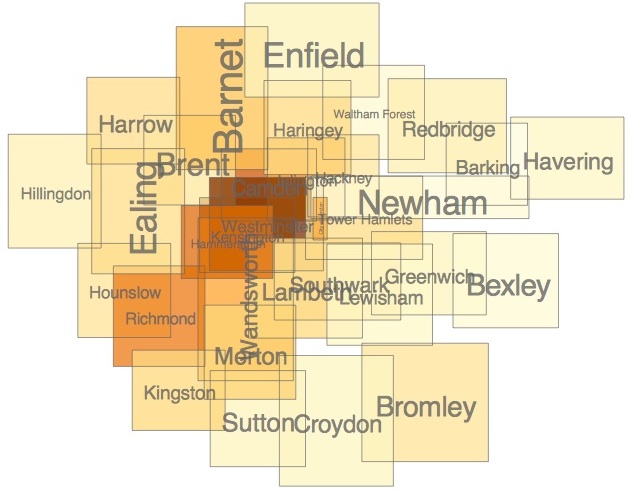
Spatially ordered treemaps

0
Reflections on a geovisualization mashup