There will be five giCentre posters at IEEE InfoVis this year.
Work that will be presented at the meeting in Chicago, Illinois includes visualization to ...
- support crime analysis - http://openaccess.city.ac.uk/12331
- explore temporal data - http://openaccess.city.ac.uk/12332
- model survey response rates - http://openaccess.city.ac.uk/12333
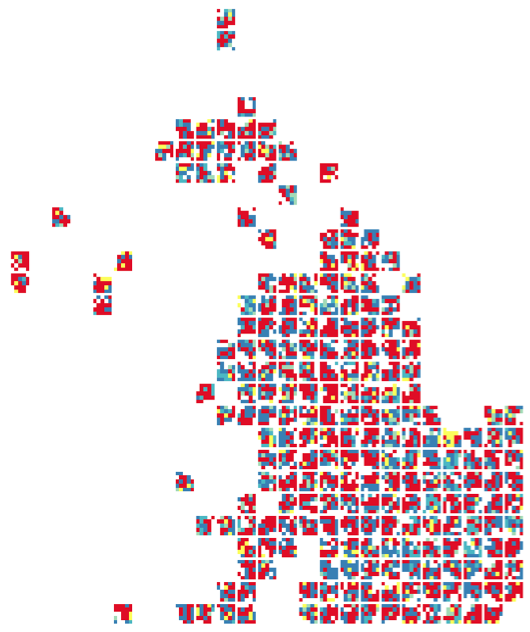
- show space, time and attribute concurrently - http://openaccess.city.ac.uk/12334
- pick stocks - http://openaccess.city.ac.uk/12335
Roger, Rafael, Kaisa and Sergi will be at the posters event on Weds October 28th, hoping to discuss their work.
Posters, abstracts and short movies are available through City's Open Access repository.